ECG Leads Comparison of Dyno Series and its Behavior to Standard ECG leads Characterization
Available online www.jsaer.com
Journal of Scientific and Engineering Research, 2018, 5(6):290-298
ISSN: 2394-2630
Research Article
CODEN(USA): JSERBR
ECG Leads Comparison of Dyno Series and its Behavior to Standard ECG leads Characterization
Nik Tehrani
International Technological University
Abstract The purpose of this report is to characterize Dyno 100/50 ECG leads and compare its behavior to standard ECG leads. The standard ECG leads considered are lead 1 to VI and unipolar leads aVL, aVR and aVF. The goal is to demonstrate how close Dyno 100/50 ECG leads are to traditional ECG leads and quantify its similarity/differences. Two approaches were taken to quantify similarities and differences between classical ECG leads and the Device lip lead. The first method focuses on quantifying the degree of similarity based on beat by beat analysis of 7 fiducial points of an ECG beat. These points are shown in an example comparing fiducial points between a synchronized beat from Device and -aVR lead of a classical ECG. In the second analysis method the fiducial points are derived from the template rather than beat by beat analysis. The difference between the two methods would be in the standard deviation since template is a beat average and averaging process is a linear operation. Based on the comparison of 7 fiducial points of the QRS complex and the analysis of results from 10 different subjects and 30 records, Device acquires a lead I with a high probability (70%). The true characteristics of the lip lead is a variation of lead I as the lip lead is located between the contacts of a standard lead I however, it closely resembles a lead I when compared to all standard ECG leads.
Keywords Dyno 100/50 ECG leads, standard ECG leads, device lip lead, beat by beat analysis
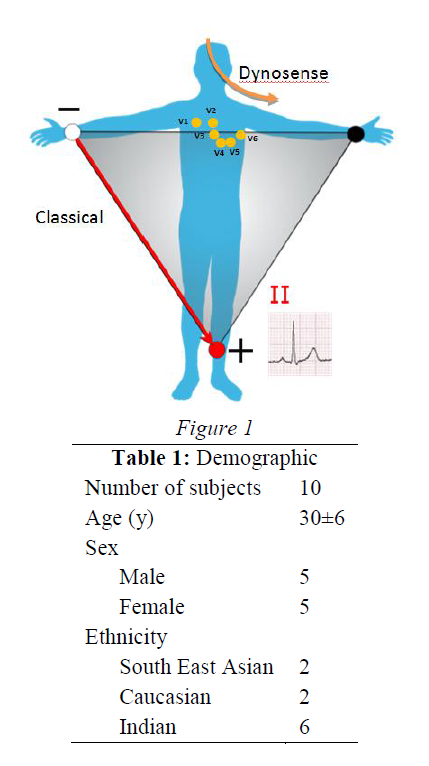
Introduction The purpose of this report is to characterize Dyno 100/50 ECG leads (designed and manufactured by DynoSense Corp.) and compare its behavior to standard ECG leads. The standard ECG leads considered are lead 1 to VI and unipolar leads aVL, aVR and aVF. The goal is to demonstrate how close Dyno 100/50 ECG leads are to traditional ECG leads and quantify its similarity/differences. 1. Device ECG Lead CharacterizationTest Setup The device will output an ECG signal between that expected from Lead I or Lead II, due to the direction of electrical conduction from lip to thumb. Considering Einthoven’s triangle, the Device ECG signal is expected to bear more similarity to a Lead that is placed between lead I and II [1]. 2. Test Setup and Data Collection: The data was collected from a standard six lead ECG device with hydro gel. The lead configuration for the baseline measurement is shown above. The leads from the lip, left arm and the ground (left hand index finger) correspond to the lead configuration of the device. This configuration allows for a simultaneous measurement of all standard leads (Lead I-VI) and the lip lead. The sampling rate was set to 500 Hz to be compatible with Device. Hydro gel was used in all the leads, lip, left arm and the ground contacts for Device. 3. Population and sample size The setup was used on 10 participants that consist of male and female above 21 at different age groups. Three data sets were collected from each participant, a total of 30 records. Table 1 shows the demographic of the study population.
Available online www.jsaer.com
290
Tehrani N
Journal of Scientific and Engineering Research, 2018, 5(6):290-298
Sample size calculation and justification:
The sample size calculation is based on a binomial distribution that corresponds to number of successes X in N independent and identically distributed (iid) Bernoulli trials. The sample size calculation based on the Bernoulli distribution trial is estimated using the following formula
Sample size of 10 (10 subjects) is toward the upper limit.
Data Analysis Methodology:
The goal of this study is to analyze and quantify similarities and differences between ECG signals from standard ECG leads vs. Device leads. We have taken two approaches to quantify similarities and differences between classical ECG leads and the Device lip lead.
Available online www.jsaer.com
291
Tehrani N
Journal of Scientific and Engineering Research, 2018, 5(6):290-298
The goal of this study is to analyze and quantify similarities and differences between ECG signals from standard ECG leads vs. Device leads. We have taken two approaches to quantify similarities and differences between classical ECG leads and the Device lip lead.
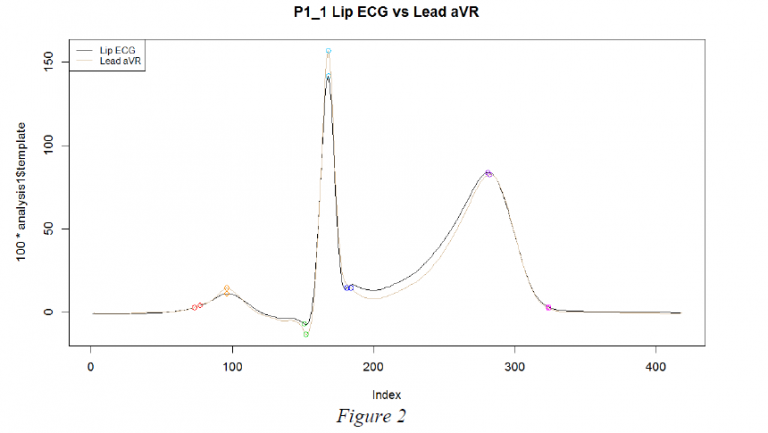
The points on the QRS complex are: P-wave Start, P-wave Peak, Q point, R point, S point, T-wave Peak & Twave end point.
These points are used for different ECG QRS complex characterization and feature extraction such as measurement of PR interval, QT interval, QRS width etc [3]. In our analysis we use the same points to quantify the differences and similarities between Device ECG lead and a classical ECG lead. The difference between coordinates of each point in x and y directions (time and ECG amplitude from Device and a classical ECG lead) are measured automatically and stored as delta t and delta_h parameters [4]. We use delta_t and delta_h to calculate the difference between same fiducial points between leads and the Euclidean distance of the QRS complex. The mean, variance and the Euclidean distance from all beats (beat by beat) are calculated and stored for further analysis. Similar analysis methodology is applied to other fiducial points and the same statistics are calculated. Table 1 shows the average delta_t and delta_h (statistical mean) for user1 and dataset 1 between the lip lead and standard ECG leads for each fiducial point. The rows in the table show delta_t and delta_h between lip and a standard ECG lead while the columns show delta_t and delta_h value for each fiducial point. A table with more details that includes, mean, standard deviation and Euclidean distance for all points, all users and all datasets are stored in Results ALL.xlxs available in our secure server (Google Drive: Google Drive\FDA_docs\ECG\LeadMappingUpdate_Nov2016).
Applying this analysis technique between the lip lead (Device) and different classical ECG leads quantify the difference at that particular point. The lead configuration with the smallest mean value and Euclidean distance indicates the most similar lead to the lip lead at that particular point. The standard deviation shows the variability around the mean at each point from beat to beat for the all the beats in the data. A large standard deviation indicates bigger noise and baseline variation in that dataset.
In order to characterize the overall similarity of a classical ECG lead to Device lead (leap lead) we can use different methodologies. One approach is to compare the difference at each point between the means to find the closest match between the lip lead (Device) and a standard lead. This approach reveals how close two leads are on a point-wise basis. The compared leads can be very close at some points but differ in some other parts of the QRS complex. The overall Euclidean distance is a single measure that can quantify how close two functions or signals are. Comparison of the two ECG leads (Device vs. standard lead) on the basis of seven fiducial points
Available online www.jsaer.com
292
Tehrani N
Journal of Scientific and Engineering Research, 2018, 5(6):290-298
can be considered as calculating the distance between two points in a seven dimensional space [5]. The smaller the overall Euclidean distance the closer the lip lead is to the classical ECG lead.
We have also used the correlation analysis as a second method to further confirm the results obtained by comparison of the beat by beat fiducial points.
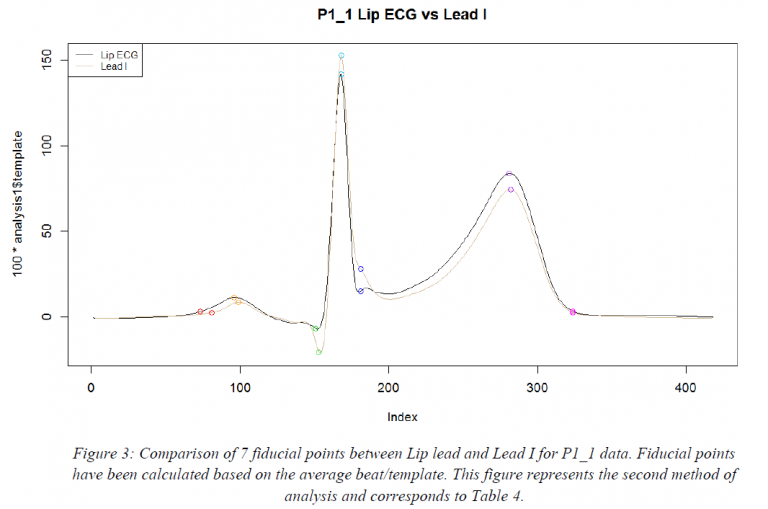
The second method of analysis is to use the concept of average beat or template beat to calculate fiducial points of the QRS complex. The template calculation is based on an algorithm that determines the dominant RR interval to determine the beat length. The average beat/template can be defined as the expectation of all beats when they are all aligned at the R peak.
ECG Template E(All beats aligned at R peak)
The template method is used in Device to eliminate corrupt or invalid beats due to distortion caused by severe baseline movement or DC offset. This methodology safeguards Device’s heart rate calculation algorithm by identifying and eliminating highly distorted beats.
In the second analysis method we derive the fiducial points from the template rather than beat by beat analysis. The difference between the two methods would be in the standard deviation since template is a beat average and averaging process is a linear operation. We expect the mean of fiducial points of the QRS complex from beat to beat analysis to be close to that of the template while the standard deviation can vary due to larger variation from beat to beat.
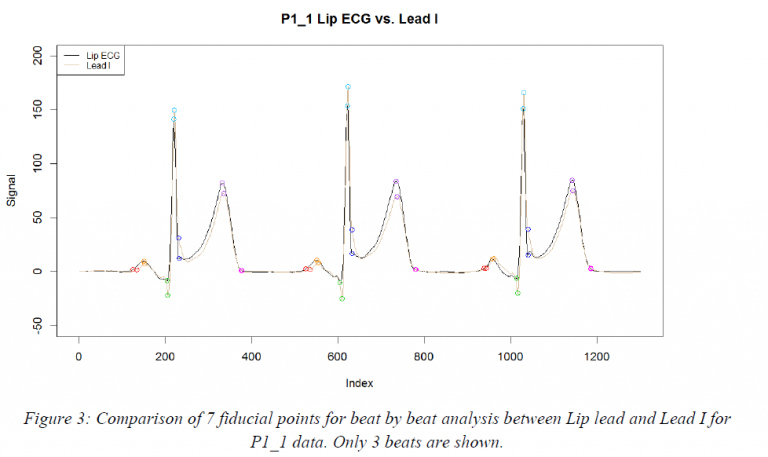
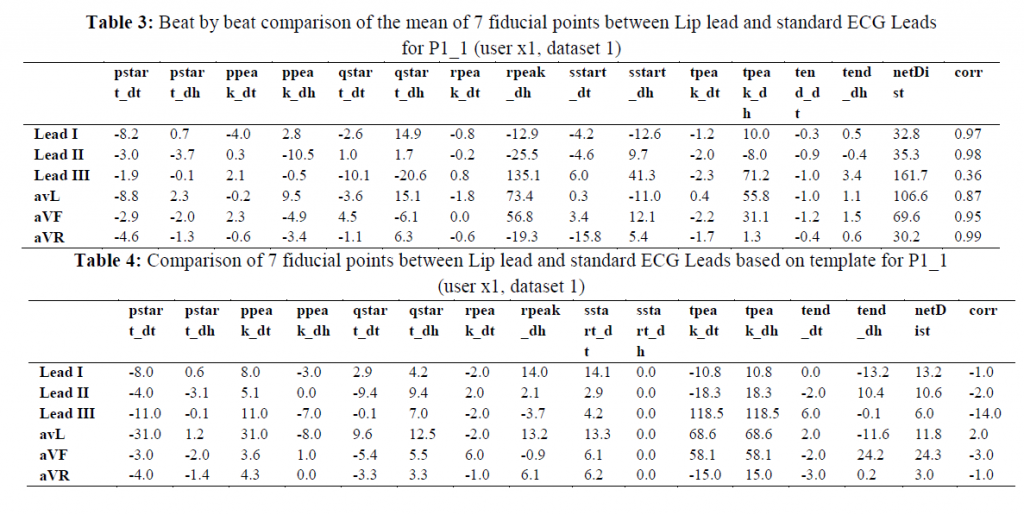
Table 3 shows the results of beat by beat analysis between seven fiducial points between lip lead (Device) and standard ECG leads. The values in the table show the mean values of time differences (delta_t) and amplitude differences (delta_h) for each fiducial point along with Euclidean distance and correlation coefficient for all points and the QRS complex (beat).
Table 4 shows the results of differences between lip and a standard ECG lead for every point in time, amplitude for every point and the Euclidean distance of all points and correlation coefficient of the QRS complex (beat) using the template method.
Label p1_1 in the left most column identifies participant 1 and dataset 1. The first numerical index refers to the participate code and the second index refers to the dataset for that participant. Each user has three datasets.
Available online www.jsaer.com
293
Tehrani N
Journal of Scientific and Engineering Research, 2018, 5(6):290-298
Determination of Lead Mapping for the lip lead:
The information presented in table 3 and 4 is used to quantify the resemblance of the lip lead to the standard ECG leads. Since the point by point comparison of the fiducial points only allow for localized comparison, we use the total Euclidean distance as a measure of how close the two leads are. In the localized comparison the two ECG signals may be close at few points but far on other points. The Euclidean distance is a comprehensive measure of distance between all points. The Euclidean distance can be considered as a distance measure of two
Available online www.jsaer.com
294
Tehrani N
Journal of Scientific and Engineering Research, 2018, 5(6):290-298
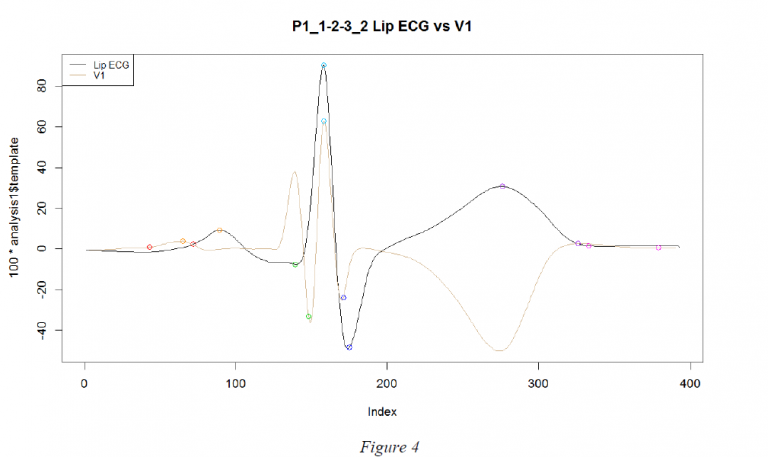
functions/signals in a seven dimensional space (7 fiducial points). This method is used in both analysis schemes (beat by beat and template base) to determine the mapping of the lip lead to the standard ECG lead. The correlation is only provided as a confirmation of the Euclidean measure technique. The comparison of the lip lead to V1 – V6 leads showed a large Euclidean distance and a low correlation. An example of P1_1 between lip lead and V1 is shown below based on the template scheme
Available online www.jsaer.com
295
Tehrani N
Journal of Scientific and Engineering Research, 2018, 5(6):290-298
Results Analysis:
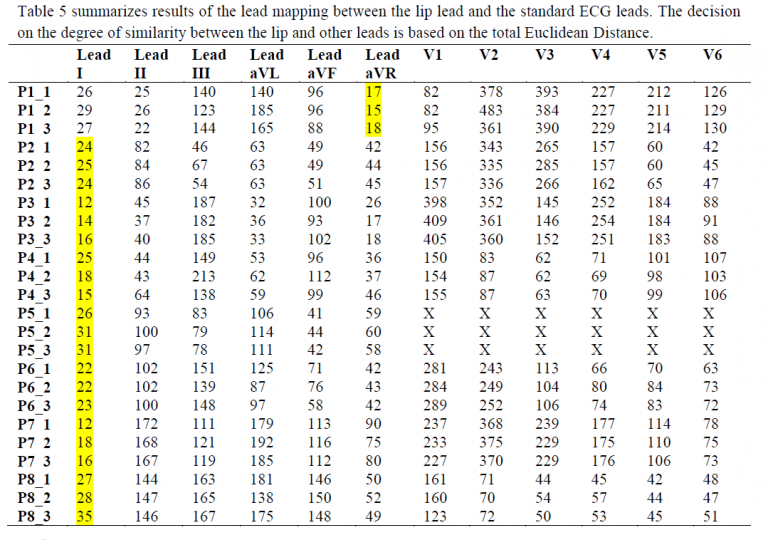
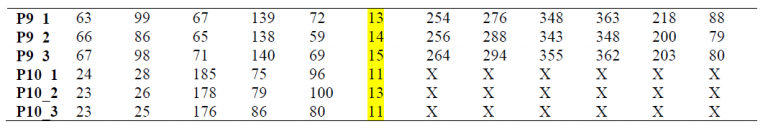
Table 5 shows the results for Euclidean distance calculation between the lip lead and standard ECG leads (unipolar leads and V1-V6) for all 30 records. Some of the entries in the table are marked as X. The X’s refer to cases where the leads’ data were omitted from the analysis due to low quality. Since all unusable data were from leads V1 – V6 (two cases, subject 5 and 10) and our preliminary analysis showed dissimilarity between the lip lead and V1-V6 leads the rest of the data for these subjects i.e. data from the main and the unipolar leads, were included in the analysis despite the fact that V1-V6 lead data was not usable. All the leads with the lowest Euclidean distance are highlighted indicating the closest match between the lip lead and the standard ECG lead. The results of table 5 shows that 7 out of 10 subjects (21 records out of 30 total records) the lip lead maps to lead I and 3 out of 10 maps to –aVR (9 records out of 30 total records). Examples of plots of the lip lead template vs. standard ECG leads are provided in Appendix A.
Conclusions
Based on the comparison of 7 fiducial points of the QRS complex and the analysis of results from 10 different subjects and 30 records we have determined that Device acquires a lead I with a high probability (70%). The true characteristics of the lip lead is a variation of lead I as the lip lead is located between the contacts of a standard lead I however, it closely resembles a lead I when compared to all standard ECG leads.
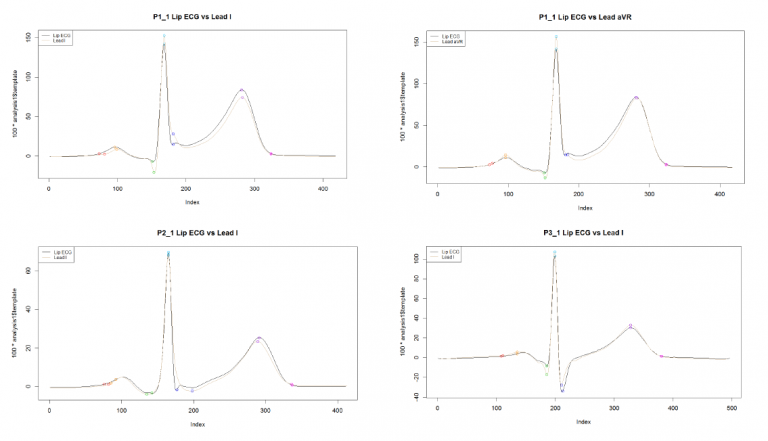
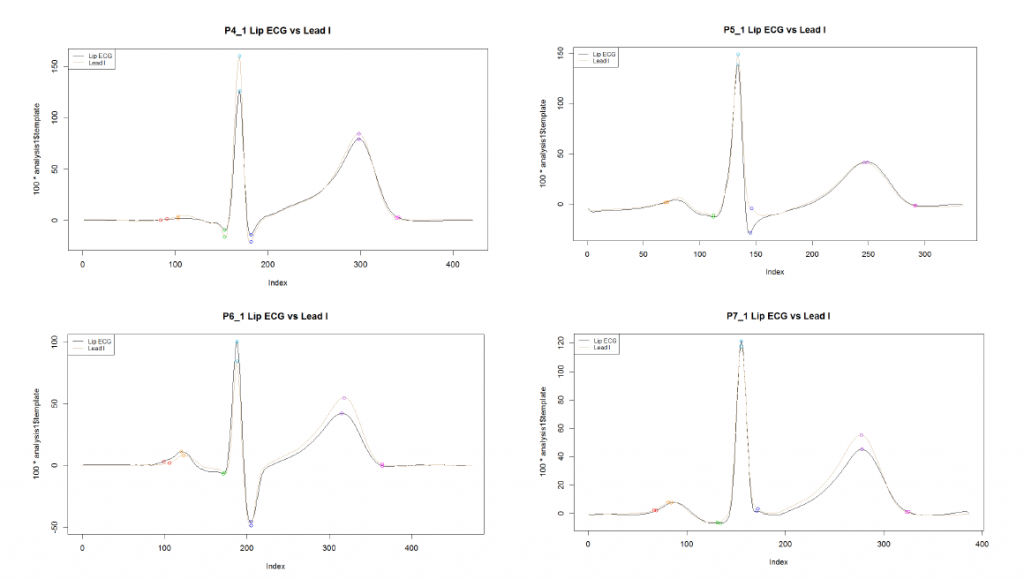
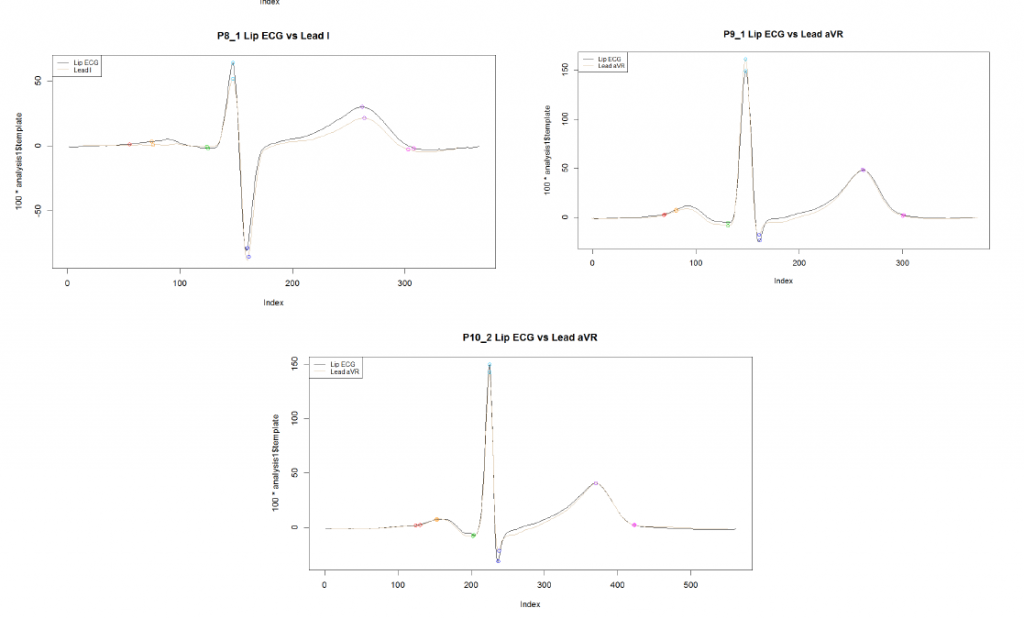
Appendix A:
Examples of plots of comparison of 7 fiducial points for all study subjects based on the template technique to demonstrate the applicability of the analysis technique used across different types of QRS morphologies.
Available online www.jsaer.com
296
Tehrani N
Journal of Scientific and Engineering Research, 2018, 5(6):290-298
Available online www.jsaer.com
297
Tehrani N
Journal of Scientific and Engineering Research, 2018, 5(6):290-298
References
[1]. ECG Learning Center. (2018). Characteristics of the Normal ECG. Retrieved from https://ecg.utah.edu/lesson/3 [2]. Fiducial Points & Contours. (2018). MBF bioscience. Retrieved from http://www.mbfbioscience.com/help/ml/Content/Concepts/fiduc_contours.htm [3]. Clinical ECG interpretation. (2018). ECG interpretation: Characteristics of the normal ECG (P-wave, QRS complex, ST segment, T-wave). Retrieved from https://ecgwaves.com/ecg-normal-p-wave-qrs-complex-st-segment-t-wave-j-point/ [4]. QRS Morphology. (2018). ECG Pedia. Retrieved from https://en.ecgpedia.org/wiki/QRS_Morphology [5]. Peng, L., Yang, L., (1999). The curl in seven dimensional space and its applications. Approximation Theory and its Applications. Volume 15, Issue 3, pp 66–80. DOI https://doi.org/10.1007/BF02837124